
Manufacturing turnover averages 28% annually across all sectors, with significant variation by sub-industry, role type, and geographic region. This research provides benchmarks manufacturers can use to set realistic goals, diagnose retention drivers, and prioritize programs with measurable ROI.
Key findings from our 2025 manufacturing turnover analysis:
- Overall manufacturing turnover averages 24% to32% annually, with a median of around 28%
- Production roles experience higher turnover (30% to 38%) than skilled trades positions (12% to 18%)
- Food processing leads sub-industries at 36% average turnover
- Southern manufacturing regions show 4% to 6% higher turnover than national averages
- Companies with structured retention programs reduce turnover by 20% to 28%
Manufacturing Turnover By Sub-Industry (2025)
Attrition varies by operating conditions, automation level, and pay compression. Use these ranges to set targets and compare plants with similar operating realities.
| Manufacturing Sub-Industry | Average Annual Turnover | Primary Turnover Drivers |
|---|---|---|
| Food & Beverage Processing | 28% to 36% | Shift volatility, sanitation demands, seasonal peaks |
| Textiles & Apparel | 26% to 34% | Repetitive work, limited advancement, heat exposure |
| Plastics & Rubber | 24% to 32% | Physical demands, equipment heat, safety requirements |
| Wood & Paper Products | 22% to 30% | Moderate rates with safety culture as key moderator |
| Metal Fabrication | 20% to 28% | Upskilling pathways help retain operators |
| Automotive Components | 18% to 26% | Pay scale ladders, cross-training reduce churn |
| Electronics Assembly | 16% to 24% | Ergonomics, clean environments support retention |
| Chemicals | 14% to 22% | Higher wages, certifications stabilize tenure |
Manufacturing Turnover By Job Category (2025)
Entry roles show higher early exits. Technical roles retain better when pay progression and training pathways are visible and frequent.
| Job Category | Average Annual Turnover | 90-Day Turnover | Key Retention Factors |
|---|---|---|---|
| General Production | 30% to 38% | 15% to 22% | Shift flexibility, supervisor relationships |
| Machine Operators | 26% to 34% | 12% to 18% | Training investment, equipment specialization |
| Quality Control | 18% to 26% | 8% to 14% | Career advancement, professional development |
| Warehouse/Logistics | 28% to 36% | 14% to 20% | Physical demands, scheduling consistency |
| Maintenance Technicians | 12% to 18% | 4% to 8% | Skill premiums, job security, certification value |
| Skilled Trades | 10% to 16% | 3% to 7% | Market demand, internal mobility opportunities |
| Production Supervisors | 14% to 20% | 5% to 9% | Leadership development, compensation growth |
| Safety Coordinators | 12% to 18% | 4% to 8% | Regulatory expertise, professional recognition |
Geographic Variations In Manufacturing Turnover (2025)
Labor markets differ in wage competition and commuting patterns. These bands reflect regional dynamics that manufacturers report most consistently.
| Region | Average Annual Turnover | Key Market Factors |
|---|---|---|
| Southeast | 26% to 34% | Rapid hiring cycles, competitive entry wages |
| Southwest | 24% to 32% | Heat exposure, long commute corridors |
| Midwest | 22% to 30% | Legacy plants with stable talent pools |
| Mountain West | 24% to 32% | Energy sector competition, rural labor challenges |
| Northeast | 20% to 28% | Higher cost of living offset by wage bands |
| Pacific Northwest | 22% to 30% | Technology sector competition, lifestyle factors |
Financial Impact Of Manufacturing Turnover (2025)
Use this directional model to quantify the financial impact and justify retention investments for budget planning.
Cost components per departing employee:
- Vacancy coverage (overtime differential, missed throughput): $2,800 – $4,200
- Recruiting and onboarding (ads, screens, HR time, PPE, training): $1,800 – $2,600
- Training productivity loss (ramp-up to standard output/quality): $3,200 – $5,100
Directional total per exit: $7,800 – $11,900
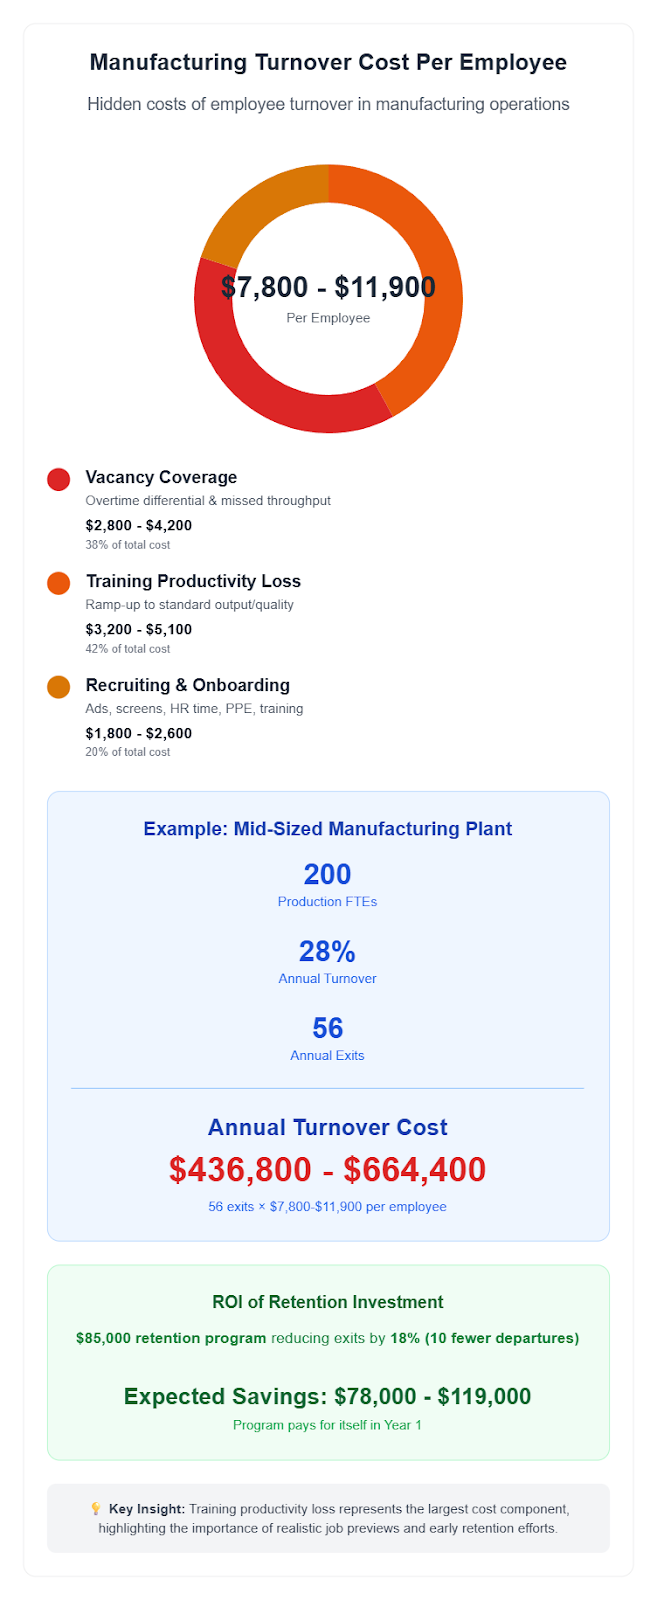
Example calculation for mid-sized plant:
- 200 production FTEs at 28% annual turnover = 56 exits
- Annual turnover cost: $436,800 – $664,400
What Drives Turnover In Manufacturing (And How To Measure It)
Measure the drivers with simple plant-level indicators to move from opinion to action planning.
| Driver | Leading Indicator to Track | Practical Target |
|---|---|---|
| Pay progression clarity | % of new hires achieving first raise within 60–90 days | ≥ 70% within 90 days when standards are met |
| Supervisor effectiveness | New hire satisfaction pulse score at day 60 | ≥ 75% favorable; coach at team level |
| Schedule fit | % of schedule change requests resolved within 30 days | ≥ 85% resolution rate for avoidable conflicts |
| Job reality vs. expectation | RJP completion rate before offer acceptance | 100% complete for heat/cold, repetitive motion, PPE |
| Advancement visibility | % of operators enrolled in cross-training tracks | ≥ 35% in year one; publicize completions |
| Commute friction | Median one-way commute minutes for new hires | ≤ 30 minutes median where feasible |
Retention Actions That Move The Numbers
Focus on actions with measurable leading indicators and near-term wins that supervisors can own and track.
| Retention Lever | What to Implement | Metric to Watch | Typical Impact Window |
|---|---|---|---|
| Day-30 pay step | Pre-defined skill check for early raise | % completing pay step by day 45 | 60 to 90 days |
| Realistic job preview | Video plus floor walk pre-offer for target roles | 90-day turnover in those roles | 1 to 2 quarters |
| Supervisor coaching | Weekly 1:1 template for first 60 days | New hire satisfaction at day 60 | Immediate to 1 quarter |
| Schedule guardrails | Fixed start times or posted rotations | Absence and tardy rate by crew | 1 to 2 quarters |
| Cross-training ladder | Visible path with skill badges and pay bands | Enrollments and badge completions | 2 to 3 quarters |
| Commute-friendly recruiting | Targeted routes and shift alignment | Acceptance rate by ZIP cluster | Immediate to 1 quarter |
Manufacturing Retention By Company Size
Different manufacturing company sizes face unique retention challenges that require tailored approaches based on resource constraints and organizational capabilities.
| Company Size | Typical Turnover | Most Effective Strategies | Budget-Friendly Focus |
|---|---|---|---|
| Small (Under 100 employees) | 24% to 32% | Direct supervisor engagement, cross-training opportunities | Peer recognition programs, flexible scheduling |
| Mid-Size (100–500 employees) | 26% to 34% | Formal mentoring programs, skills-based advancement | Supervisor training, performance management systems |
| Large (500+ employees) | 28% to 36% | Analytics-based interventions, leadership development | Enterprise retention technology, culture transformation |
Seasonal Patterns In Manufacturing Turnover
Manufacturing turnover shows predictable seasonal variations that help companies proactively plan retention efforts and staffing strategies.
| Quarter | Turnover Pattern | Primary Drivers | Retention Focus |
|---|---|---|---|
| Q1 (Jan–Mar) | 18% above average | Post-holiday departures, new year job searches | Engagement initiatives, goal setting |
| Q2 (Apr–Jun) | 6% above average | Spring hiring season, graduation job entries | Career development, advancement discussions |
| Q3 (Jul–Sep) | 12% above average | Summer schedule conflicts, back-to-school transitions | Flexible scheduling, family support |
| Q4 (Oct–Dec) | 8% below average | Holiday retention bonuses, reduced job market activity | Recognition programs, year-end incentives |
How To Benchmark Your Plant In 30 Minutes
Quick assessment process to identify retention priorities and set measurable targets.
Step-by-step benchmarking process:
- Pull the last 12 months of exits and categorize by tenure bands: 0-30, 31-90, 91-180, 181+ days
- Calculate turnover rates for each job category using headcount averages
- Compare to the tables above and highlight any category above the top of the band
- Select two drivers to improve based on the biggest gaps identified
- Set numeric targets with owners and review dates
- Publish baseline and targets to supervisors for weekly review over 8 weeks
How The Resource Supports Manufacturing Retention
The Resource builds stable, productive teams through realistic job previews, early pay progression, and supervisor coaching that targets the first 60-90 days. Plants use our commuter-friendly recruiting and schedule guardrails to raise acceptance and cut early exits.
Our manufacturing workforce solutions:
- Pre-screened candidates with proven manufacturing experience and cultural fit
- Skills assessment matching workers to appropriate roles and advancement paths
- Retention consulting to identify and address turnover root causes systematically
- Temp-to-hire programs allow extended evaluation periods before permanent commitment
Start with a no-pressure diagnostic. We will baseline your 90-day turnover, identify two driver gaps, and return an action table with targets your supervisors can own.
Ready to reduce your manufacturing turnover costs? Please call us today at 336-896-1000 or contact us using our online form to discuss how our specialized approach can help build stronger, more stable teams for your operation.
Methodology And Data Sources
This report synthesizes publicly available labor data with manufacturing-specific surveys to produce 2025 directional benchmarks. We used the BLS JOLTS series to anchor separations/turnover levels at national and industry tiers, then applied weighted modeling by sub‑industry, role scarcity, environment, schedule type, and regional wage competition to distribute ranges across segments. Where precise cuts weren’t published (e.g., 90‑day turnover by role), we derived estimates from known relationships between early attrition and environmental/shift factors, then calibrated against recent manufacturing workforce studies.
How to use this report:
- Treat figures as directional benchmarks. Calibrate with your plant’s role mix, shift model, and local labor conditions.
- For peer comparisons, benchmark within your 30–50-mile commuting radius, where wage competition and schedules are most comparable.
- Track leading indicators (pay step completion, day‑60 satisfaction, commute minutes) to validate which drivers move your numbers.
Primary sources (linkable):
- BLS JOLTS (Job Openings and Labor Turnover Survey) – National and Industry Series https://www.bls.gov/jlt/
One‑screen query tool (custom industry/region cuts): https://data.bls.gov/PDQWeb/jt - BLS Manufacturing Industry Overview (NAICS 31‑33 context) https://www.bls.gov/iag/tgs/iag31-33.html
- NAM – Manufacturers’ Outlook Survey (workforce sentiment, operating conditions) https://www.nam.org/series/outlook/
- The Manufacturing Institute – Workforce Research (skills, pipeline, retention) themanufacturinginstitute.org/research/
- SHRM – Human Capital Benchmarking (turnover/retention references) shrm.org/resourcesandtools/business-solutions/human-capital-benchmarking
- Federal Reserve – Beige Book (regional labor conditions, wage pressures)
Additional regional context (examples):
- NC Department of Commerce – Labor Market Information https://www.commerce.nc.gov/data-tools-reports/labor-market-data
- Texas Labor Market Information (TWC) https://texaslmi.com/
Definitions:
- Turnover (annual): Exits during period ÷ average headcount for period
- 90‑day turnover: Exits within 90 days ÷ starts for that cohort
- Skilled trades: Maintenance, industrial electricians, instrumentation techs, similar roles
Limitations:
- Some breakouts (e.g., sub‑industry by role category at 90‑day) are not directly published; these are modeled from published totals plus observed drivers. Validate locally before setting incentives or SLAs.