Key Takeaways
Temporary staffing agency markup rates across U.S. industries typically fall within a broad range of 25% to 65% in 2025, with significant variation by sector and skill level. Service complexity also contributes to variation.
Manufacturing and clerical roles tend to sit at the lower end of that band, while specialized professional and technical services are frequently higher. Public guidance for buyers shows even wider possible ranges in some scenarios, so “typical” should always be validated against role, risk, and market conditions. Transparent, all‑in pricing models from established agencies often provide better value than low‑markup quotes that add hidden fees later.
North Carolina temp agency markups generally align with national patterns. In competitive markets like the Triad, long‑tenured firms leverage operational efficiency and buyer volume to offer competitive, all‑in pricing without cutting quality.
What You’ll Learn
- Industry‑specific markup ranges: Manufacturing vs professional services vs government contract rates.
- Service level impact: Temporary vs temp‑to‑hire vs contract pricing differences
- Markup component breakdown: What businesses actually pay for in staffing fees
- North Carolina regional analysis: Triad market pricing and competitive landscape
- Value optimization strategies: How to evaluate actual staffing costs beyond markup percentages
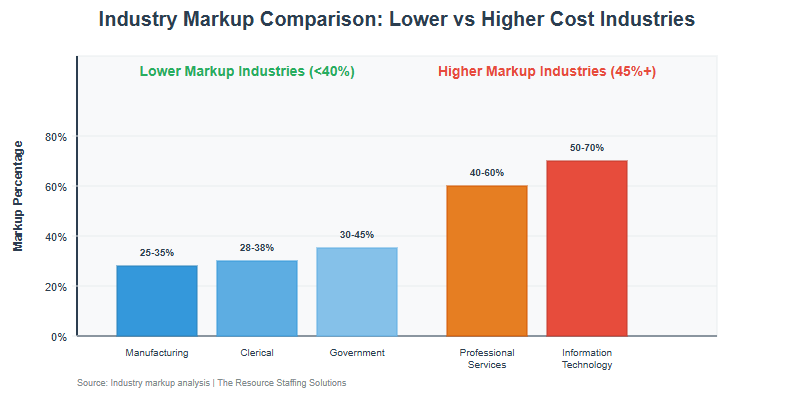
Average Temp Agency Markup by Industry (2025 Data)
Understanding industry‑specific markup ranges helps you accurately budget and evaluate proposals.
| Industry | Average Markup % | Typical Range | Primary Cost Drivers |
|---|---|---|---|
| Manufacturing | about 28% | 25% to mid 30% | Safety training Workers’ comp Volume onboarding |
| Clerical/Administrative | about 32% | high 20% to high 30% | Background checks Skills tests Quick cycles |
| Professional Services | about 52% | mid 40% to mid 60% | Specialized sourcing Credentials verification |
| Information Technology | about 58% | 50% to 70% | Technical screening Security requirements Project risk |
| Government Contracts | about 35% | 30% to mid 40% | Compliance requirements Insurance Bonding where required |
Notes: Published buyer guidance places “typical” staffing markups broadly from about 25% to as high as 75% or more, depending on role and conditions, with some advisory content cautioning buyers that markups can exceed 50% in higher‑risk or specialized cases. See Sources.
How Industry Markups Compare
The chart below illustrates the markup variation across different industries, showing how specialized roles command higher premiums than volume-based positions.
Markup by Service Type and Duration
Service complexity and placement duration influence fee structures.
| Service Type | Average Markup % | Duration Factor | Key Services Included |
|---|---|---|---|
| Temporary Staffing | around 30% | Short‑term flexibility | Payroll Workers’ comp Basic screening |
| Temp‑to‑Hire | high 30% | Evaluation period | Conversion terms Replacement windows |
| Contract Staffing | mid 40% | Project‑based | Specialized sourcing Account management |
| Direct Hire (Fee %) | 20% to 25% of salary | Permanent | Comprehensive screening Replacement guarantee |
Notes: Actual percentages depend on role, risk, volume, and local market. Public buyer guides commonly cite 25% to 50% markups for many temporary use cases, with specialized roles above that.
Service Level Considerations
Different service types reflect varying levels of complexity and risk, which directly impact pricing structures.
Temporary staffing: Lower markups reflect streamlined cycles and volume leverage, but limited specialized screening depth.
Temp‑to‑hire: Higher markups reflect the added evaluation period and conversion support.
Contract staffing: Premiums reflect specialized sourcing, project deliverables, and sustained account management.
What’s Included in Agency Markup Rates
Markup percentages represent bundled services rather than a simple placement toll. Typical inclusions:
- Payroll administration: Weekly payroll, tax withholding, direct deposit, W‑2 administration
- Statutory coverages: Workers’ compensation, unemployment insurance, liability coverage
- Recruitment activities: Sourcing, advertising, interviews, skills tests, background checks
- Account management: Client support, scheduling, issue resolution, performance monitoring
- Compliance overhead: Technology systems, E‑Verify, I‑9 processing, recordkeeping, facilities
Notes: The exact share of each component varies substantially by industry, role risk, and state requirements. Rather than fixed percentages per component, request an itemized description of inclusions for apples‑to‑apples comparisons.
North Carolina Regional Markup Analysis
The North Carolina Triad is a competitive staffing market, with many agencies active across Greensboro, Winston‑Salem, and High Point. Markups broadly align with national patterns, with competitive pressure around high‑volume clerical and light industrial segments and higher premiums for technical and professional roles.
Regional Pricing Factors
Several key factors influence staffing agency pricing in the North Carolina market, creating both opportunities and challenges for buyers.
Market competition: A high density of agencies in Greensboro and the broader Triad helps keep buyer options open and pricing competitive for common roles.
Volume relationships: Long‑term partnerships and regional experience improve forecast accuracy, onboarding efficiency, and fulfillment speed, supporting competitive all‑in rates at scale.
North Carolina Industry Markup Patterns
Regional market dynamics create specific patterns across different industry sectors in North Carolina.
| NC Sector | Markup Range | Regional Advantages |
|---|---|---|
| Manufacturing (Triad) | mid 20s to low 30s | Volume programs Safety expertise Fast backfills |
| Professional Services | low 40s to mid 50s | Local talent networks Vetting depth |
| Government | low 30s to about 40% | Compliance experience Set processes |
| Technology (Triangle) | high 40s to low 60s | Technical screening Clearance capability |
Notes: Use these as planning bands. Final rates depend on role, location, volume, lead time, risk, and coverage terms.
Hidden Costs and Transparent Pricing Models
Beyond the headline markup, evaluate the total cost of a staffing partnership, including any add‑on fees.
Common Add‑Ons to Watch
| Fee Type | Typical Cost | When Charged |
|---|---|---|
| Candidate Replacement | Often specified in a contract | Early termination inside the guarantee window |
| Background Checks | about $25 to $100 per check | Role‑specific screens: MVR Criminal Education |
| Skills Testing | about $15 to $75 per test | Technical assessments Professional assessments |
| Administrative Setup | about $100 to $500 | New client onboarding System setup |
| Contract Modifications | about $50 to $200 | Mid‑contract changes Amendments |
- All‑inclusive markup models: Reduce surprise charges and simplify budgeting
- Clear service definitions: Document what screening, support, and guarantees are included
- Volume pricing transparency: These show how tiered volumes affect per‑employee costs
Calculation Methodology
Markup Rate Formula
Markup Rate = (Bill Rate − Pay Rate) ÷ Pay Rate × 100
Example: Employee paid $15/hour, client billed $20/hour = 33.3% markup
Data Sources and Verification
Primary sources
- Publicly available buyer guidance from reputable staffing finance, HR, and industry advisory resources
- ASA industry statistics, playbooks for structural context
- BLS wage data, cost data for local wage baselines, and trend context
- North Carolina workforce data for regional labor conditions
Approach
- Use widely cited public ranges for “typical” markups as planning bands
- Adjust by service type, industry complexity
- Surface common add‑ons, clarify inclusions for apples‑to‑apples comparisons
Value Optimization Strategies
Smart buyers look beyond headline markup percentages to evaluate the total value proposition of staffing partnerships.
Evaluating True Staffing Costs
Total cost analysis: Compare all‑in pricing, including potential add‑ons, not just the headline markup
Service level assessment: Weigh screening depth, guarantees, responsiveness, and reporting relative to price
Volume pricing evaluation: Understand tiered discounts, how volume commitments change per‑hour cost
Partnership Selection Criteria
Transparent pricing models with clear inclusions
Local market expertise for accurate pay rates, candidate availability
Proven client relationships that demonstrate consistent delivery, sustainable pricing
Further Reading & Industry Analysis
- Industry‑specific markup guides: Manufacturing, professional services, government contract strategies
- Cost optimization playbooks: Evaluating true total staffing costs
- Regional analysis: North Carolina workforce cost patterns, competitive intelligence
- Transparent pricing evaluation: Identifying hidden fees, comparing all‑inclusive proposals
Next Step: Contact The Resource at 336‑896‑1000 for a transparent markup analysis and a competitive pricing evaluation tailored to your North Carolina staffing needs.
Sources and Data References
- SHRM: Buyer guidance on staffing markups
“Markups can range from 30 percent to 40 percent to as much as 150 percent. As a rule of thumb, look very carefully at anything over 50 percent.”
https://www.shrm.org/topics-tools/news/hr-magazine/art-choosing-staffing-agency
- Advance Partners (Paychex company): Staffing bill rate calculator and markup overview
Typical markups range from 25% to 100% depending on role and market conditions
https://www.advancepartners.com/calculate-how-to-price-your-staffing-services/
- HCMWorks: Buyer advisory on agency markups
Typical ranges often cited from about 20% to 50% for many cases, varying by role and region
https://www.hcmworks.com/blog/why-businesses-need-to-pay-attention-to-staffing-agency-markup-rates
- altLINE (SouthState Bank): Explainer on staffing agency markup rates and bill rate math
https://altline.sobanco.com/staffing-agency-markup-rates/
- MyBasePay: Advisory on typical markup bands and drivers (role risk, benefits load, market)
https://mybasepay.com/how-to-determine-the-best-markup-for-your-staffing-agency/
- ASA: Staffing industry statistics (structural context; employees, segments)
- BLS: Employment Cost Index and wages (context for regional pay baselines)
- North Carolina Department of Commerce: Labor market context (regional workforce data)
https://www.commerce.nc.gov/data-tools-reports/labor-market-data
Notes
The industry and service type ranges above are planning bands based on public buyer guides and advisories; precise markups should be validated against the specific role, volume, risk profile, and market conditions. Add‑on fee examples reflect common ranges from screening vendors and buyer reports; actual costs vary by provider and package.