Key Takeaways
The average time required to fill an open position reached 63 to 68 days nationally as of January 2026, nearly double the 36 to 44 days reported in 2023. In technical roles, candidates now spend an average of 23.3 hours in interviews before an offer is made. Persistent candidate shortages and expanding interview processes have both contributed to longer hiring cycles across industries. Greater role specialization has also contributed to the trend. Understanding current benchmarks across industries, seniority levels, and role types helps HR leaders and hiring managers set accurate timelines and plan for workforce continuity during extended vacancies.
This analysis draws from SHRM benchmarking research and LinkedIn Talent Solutions data. Additional sources include Workable industry analytics and the Ashby Talent Trends Report. Deloitte recruitment efficiency studies and Lightcast economic research are also referenced.
What You’ll Learn in This Report
- National Time-to-Hire Benchmarks: Current averages from multiple authoritative sources
- Time to Fill by Industry: Sector-level breakdown across major U.S. industries
- Time to Hire by Role Seniority: Entry-level to executive-level timelines
- Factors That Affect Hiring Timeline: Variables that shorten or extend the process
- Cost of Extended Vacancy: Daily and monthly financial impact of open positions
- Data Sources: Full source list with links
National Time-to-Hire Benchmarks
National hiring benchmarks vary by methodology, source population, and whether the metric measures time to fill or time to hire. The figures below show the current range employers are using for 2026 workforce planning.
| Metric | Benchmark | Year |
|---|---|---|
| Average time to fill, all industries | 36 days | 2024 |
| Average time to fill, all industries | 42 days | 2025 |
| Average time to fill, all industries | 63 to 68 days | January 2026 |
| Global average time to hire | 44 days | 2025 |
| Technical hire total interview hours | 23.3 hours | Q1 2026 |
| Non-technical business hire interview hours | 12.2 hours | Q1 2026 |
Key Findings: National averages compiled from SHRM Human Capital Benchmarking, Corporate Navigators, LinkedIn Talent Solutions, and the Ashby Talent Trends Report.
Key Insights:
- The average time to hire has nearly doubled in three years. National averages moved from 36 to 44 days in 2023 to 63 to 68 days by January 2026, reflecting longer interview processes and a more competitive candidate market across sectors.
- Technical roles require nearly twice as much interview time as non-technical positions. The 23.3-hour average for technical hires in Q1 2026, compared to 12.2 hours for business roles, indicates that screening complexity contributes as much to extended timelines as candidate scarcity does.
- No single benchmark reflects all hiring environments. SHRM’s 42-day average and the Corporate Navigators 63-to-68-day range reflect different methodologies and data populations. Treating these as a planning range rather than a single target produces more accurate workforce projections.
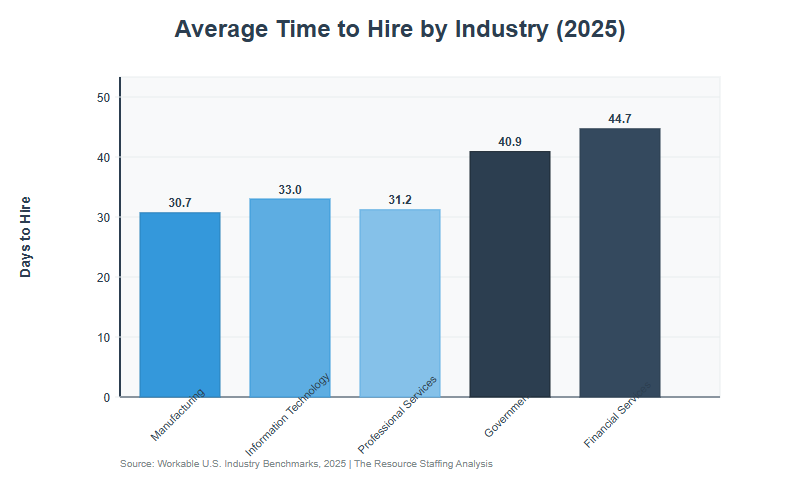
Time to Fill by Industry Level
Industry timelines differ based on candidate supply, skill requirements, and screening complexity. These benchmarks show why one companywide average can misrepresent actual hiring conditions.
Manufacturing (Assemblers, Machine Operators, Maintenance Technicians)18 to 35 days
| Industry | Average Time to Fill |
|---|---|
| Warehouse, Transport and Utilities | 24.9 days |
| Professional and Business Services | 25.2 days |
| Non-Farm (all sectors) | 28.3 days |
| Education | 29.3 days |
| Manufacturing (Assemblers, Machine Operators, Maintenance Technicians) | 18 to 35 days |
Key Findings: Warehouse, transport, professional services, non-farm, and education figures from Workable industry data. Manufacturing ranges from The Resource 2025 Time-to-Fill Benchmarks by Industry.
Key Insights:
- Warehouse and transport roles fill the fastest among major sectors. The 24.9-day average reflects larger candidate pools and fewer certification requirements compared to technical or specialized professional roles.
- Manufacturing timelines vary significantly within the sector. The 18-to-35-day range reflects the difference between general assembly positions and roles requiring equipment certifications or prior machine operation experience.
- Professional and business services track closely with warehouse timelines. The 25.2-day average suggests that common administrative and operational support roles draw from broad candidate pools, keeping timelines competitive with light industrial hiring.
Time to Hire by Role Seniority
Higher-seniority roles usually require more stakeholder review, compensation negotiation, and candidate evaluation. The table below shows how hiring timelines increase as role responsibilities increase.
| Seniority Level | Average Days to Hire |
|---|---|
| Entry-level | 46 days |
| Mid-Senior | 60 days |
| Manager | 75 days |
| Director | 90 days |
| Executive | 120 days |
Key Findings: Seniority-level averages from Genius time-to-hire research. Mitratech 2025 analysis corroborates that nearly 40% of senior-level roles take more than 90 days to fill.
Key Insights:
- Executive roles take more than twice as long to fill as entry-level positions. The 120-day executive average versus the 46-day entry-level average reflects multi-round stakeholder involvement, compensation complexity, and the length of notice periods at senior levels.
- Mid-senior and manager timelines cluster between 60 and 75 days. Mitratech 2025 data shows 44% of mid-level roles take 31 to 60 days to fill. Seventeen percent stretch past 90 days, indicating meaningful variance even within the same seniority band.
- Top candidates at every level move faster than the average suggests. SHRM research notes that top talent is typically off the market within 10 days of becoming available, creating a compressing window between when a vacancy opens and when the best candidates are gone.
Factors That Affect Time to Hire
Hiring speed is shaped by both market conditions and internal process design. The factors below identify common variables that can shorten or extend recruiting timelines.
Internal approval processPre-approved headcountApproval required at each hiring stageJob description accuracySpecific, realistic requirementsVague or misaligned expectations
Interview stagesTwo or fewer structured roundsFour or more rounds with multiple stakeholders
| Factor | Shortens Timeline | Extends Timeline |
|---|---|---|
| Candidate pool size | Large, qualified pool available | Small or highly specialized pool |
| Interview stages | Two or fewer structured rounds | Four or more rounds with multiple stakeholders |
| Job description accuracy | Specific, realistic requirements | Vague or misaligned expectations |
| Internal approval process | Pre-approved headcount | Approval required at each hiring stage |
| Market competitiveness | Lower-demand role or region | High-demand role with competing offers |
| Work location flexibility | Open to remote or hybrid candidates | On-site only in a competitive market |
Key Findings: Factors compiled from SHRM Talent Acquisition research and Ashby Talent Trends Report analysis of interview process variables and their effect on time-to-hire outcomes.
Key Insights:
- Interview process design is one of the most controllable timeline variables. Ashby productivity data shows that moving from four or more rounds to two structured rounds can reduce time-to-hire by 20 to 30 days without meaningfully reducing placement quality.
- Job description accuracy generates compounding delays when vague. Misalignment between posted requirements and actual role needs increases the volume of unqualified applicants and extends screening time. Early turnover after hire is also higher when expectations were unclear at the start.
- Work location restrictions reduce the effective candidate pool size in competitive markets. Organizations that limit hiring to on-site candidates face meaningfully smaller qualified pools for technical and professional roles, particularly in metro markets where remote-friendly competitors are common.
Cost of Extended Vacancy
Open positions create productivity gaps, overtime pressure, and delayed work. These estimates show how vacancy costs can accumulate as hiring timelines lengthen.
| Benchmark | Estimated Cost | Basis |
|---|---|---|
| Daily productivity loss per unfilled role | $500 per day | Deloitte recruitment efficiency research |
| Monthly cost per unfilled position | $25,000 per month | Lightcast open jobs economic analysis |
| Daily vacancy cost, $80,000 salary role | $307 per day | Contract Professionals, Inc. ($80,000 divided by 260 working days) |
| Average cost-per-hire, all industries | $4,683 | SHRM Human Capital Benchmarking |
| Total national cost of unfilled jobs | Over $1 trillion per month | Lightcast and Staffing Hub aggregate |
Key Findings: Financial estimates from Deloitte recruitment efficiency research, Lightcast economic analysis, Contract Professionals, Inc. formula methodology, and SHRM Human Capital Benchmarking.
Key Insights:
- A 30-day vacancy for an $80,000 role carries an estimated $9,210 to $15,000 in direct costs. The Contract Professionals formula produces $9,210. The Deloitte $500/day benchmark produces $15,000. Most organizations will fall between those two estimates depending on role’s criticality.
- The SHRM average cost-per-hire of $4,683 understates total hiring cost. That figure covers recruitment expenses and does not include productivity losses during the vacancy or ramp-up time after hire. Total cost is substantially higher for roles that take 60 or more days to fill.
- Unfilled positions represent a systemic economic problem, not just an individual employer concern. The Lightcast $1 trillion monthly national estimate reflects compounding losses across employers and underscores the structural cost of extended hiring cycles at scale.
Sources
- SHRM 2025 Recruiting Executives Benchmarking Report
National time-to-fill averages and cost-per-hire data
https://www.shrm.org/topics-tools/research/2025-recruiting-benchmarking
- Corporate Navigators: Average Time to Fill (2026 Update)
National time-to-fill benchmark as of January 2026
- Onehour.digital: Time to Hire Statistics for 2026
Aggregated time-to-hire trend data from multiple industry sources
https://onehour.digital/blog/time-to-hire-statistics
- Ashby Talent Trends Report (Q1 2026)
Interview hours by role type for technical and non-technical hires
https://www.ashbyhq.com/talent-trends-report/reports/2023-recruiter-productivity-trends-report
- Workable: Average Time to Hire by Industry
Time-to-hire by sector
https://resources.workable.com/stories-and-insights/time-to-hire-industry
- Genius: Average Time to Hire by Industry (2025 Statistics)
Seniority-level time-to-hire averages
https://joingenius.com/statistics/average-time-to-hire/
- Mitratech: What 2025 Time-to-Fill Benchmarks Reveal
Mid-level and senior-level time-to-fill distribution data
- Deloitte Recruitment Efficiency Research (via Hired AI)
Daily productivity cost of unfilled roles, $500 per day
https://hiredaiapp.com/the-hidden-cost-of-slow-hiring-what-every-recruiter-needs-to-know-in-2026/
- Lightcast: The Cost of Open Jobs
Monthly per-position vacancy cost and national aggregate
https://lightcast.io/resources/research/fiverr-pro-open-jobs
- Contract Professionals, Inc.: Cost of an Unfilled Position (2026)
Formula-based daily vacancy cost methodology
https://www.cpijobs.com/2026/03/12/cost-of-an-unfilled-position/
- SHRM Cost-Per-Hire Data (via VA Masters)
Average cost-per-hire benchmark, all industries
https://vamasters.com/cost-of-hiring-statistics-2026/
- Staffing Hub: Unfilled Jobs Are Costing the Economy Over $1 Trillion a Month
National aggregate cost of unfilled positions
http://staffinghub.com/press-releases/unfilled-jobs-are-costing-the-economy-over-1-trillion-a-month/
- The Resource: 2025 Time-to-Fill Benchmarks by Industry
Manufacturing-specific time-to-fill ranges
https://www.theresource.com/2025/10/27/time-to-fill-by-industry/