Key Takeaways
Staffing agency markup structures across placement types commonly range from 15% to 100% in 2025, with variation by service level, industry sector, and contract duration. Direct hire placements typically run 18% to 25% of the first‑year salary (20% is most frequently cited), while temporary staffing markups often fall within the 25% to 40% range for many roles, with higher markups for specialized or higher‑risk work. Temp‑to‑hire programs generally include an hourly markup during the evaluation period plus a conversion fee that can be structured as a salary percentage, flat amount, or hours‑credit buyout.
Transparent, all‑in pricing models from established agencies frequently provide better total value than low‑fee quotes with hidden add‑ons. North Carolina staffing agency pricing generally aligns with national patterns. Established agencies with decades in the market often deliver better value through operational efficiency, accurate pay benchmarking, and stronger retention outcomes.
What You’ll Learn
- Placement type pricing differences: Direct hire vs temporary vs temp‑to‑hire fee structures
- Industry markup variations: Professional services vs manufacturing vs clerical pricing patterns
- Regional pricing analysis: North Carolina market patterns and competitive landscape
- Hidden costs in staffing: Evaluating add-ons and the benefits of transparent pricing
- Value assessment strategies: Total cost evaluation beyond headline markup percentages
Average Staffing Agency Markup by Placement Type (2025 Data)
Understanding placement‑specific fee structures helps evaluate total staffing costs across hiring strategies.
| Placement Type | Fee Structure | Typical Range | Payment Timing |
|---|---|---|---|
| Direct Hire | Percentage of annual salary | 18% to 25% (20% most common) | Upon hire completion |
| Temporary Staffing | Hourly markup percentage | 25% to 40% for many roles (higher for specialized or high‑risk) | Weekly with payroll |
| Temp‑to‑Hire | Markup plus conversion fee | Markup during temp period; conversion commonly 8% to 15% of salary, flat $500 to $3,000, or hours‑credit methods | During temp period plus conversion |
| Contract Staffing | Project‑based markup | Around 30% to 50% (role and project complexity dependent) | Per contract terms |
| Executive Search | Retained Search fee | About 25% to 35% of salary | Staged payments during search |
Notes: Direct hire fees in industry sources frequently cite 15% to 30%, with 20% most commonly reported. Temporary markups for common categories are often 25% to 50% in buyer guides, with specialized scenarios extending higher. See Sources.
Placement Type Comparison Analysis
Lower total cost placements (under about 25%):
- Direct hire fees avoid ongoing hourly markups for permanent roles.
- Executive/retained search focuses premium fees on senior roles but is a one‑time cost.
- Temp‑to‑hire conversion eliminates markup after hire.
Higher ongoing cost placements (about 25% to 50%+):
- Temporary staffing includes ongoing payroll, statutory coverages, and support.
- Contract staffing reflects project complexity and specialized skills.
- Extended temp periods can accumulate significant markup over time.
Markup Variation by Service Complexity and Industry
Service-level and industry requirements drive pricing across various placement types.
| Service Level | Markup Range | Key Differentiators | Industries Served |
|---|---|---|---|
| Basic Placement | 15% to 25% | Resume screening, reference checks | General clerical, entry‑level |
| Standard Service | 25% to 35% | Skills testing, background verification | Manufacturing, admin, customer service |
| Premium Service | 35% to 50% | Comprehensive assessment, guarantees | Professional and technical roles |
| Specialized Placement | 40% to 100% | Industry expertise, certifications/clearances | Healthcare, finance, IT, executive |
Notes: Public buyer guides cite wide bands because role risk, benefits load, location, and scarcity heavily influence price. Use these as planning ranges and request itemized inclusions for apples‑to‑apples comparisons.
Industry-Specific Markup Patterns
Manufacturing and clerical roles: Typically within “standard service” ranges due to established processes and broader candidate pools.
Professional services and technical roles: Premium pricing driven by specialized sourcing, skills validation, and compliance requirements.
Executive placements: Retained engagements with staged fees reflecting seniority and search complexity.
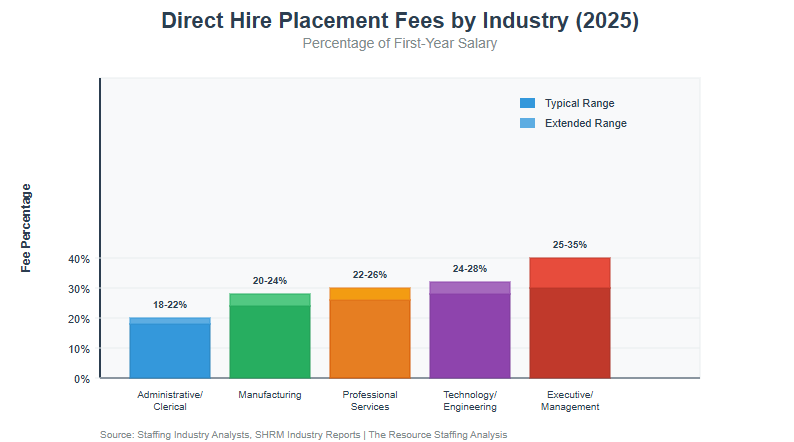
Direct Hire Placement Fee Analysis
Direct hire is a one‑time fee model that eliminates ongoing markup costs for permanent roles.
| Industry Sector | Direct Hire Fee % | Typical Guarantee Period | Replacement Terms |
|---|---|---|---|
| Administrative/Clerical | about 18% to 22% | ~90 days | Refund or free/prorated replacement |
| Manufacturing | about 20% to 24% | ~90 to 120 days | Prorated refund or replacement |
| Professional Services | about 22% to 26% | ~90 to 180 days | Replacement guarantee standard |
| Technology/Engineering | about 24% to 28% | ~90 to 180 days | Extended guarantees available |
| Executive/Management | about 25% to 35% | ~180 to 365 days | Comprehensive replacement terms |
Notes: Industry sources center direct hire in the 15% to 30% band, commonly 20% for many roles. Senior/executive searches trend higher.
Direct Hire Value Proposition Analysis
- Cost comparison: Avoids ongoing markup costs that accumulate with extended temporary periods.
- Quality assurance: Guarantee periods and replacements mitigate early attrition risk.
- Time to productivity: Professional screening reduces time‑to‑effectiveness and early turnover.
Temp‑to‑Hire Conversion Fee Structures
Temp‑to‑hire combines a temporary markup plus a conversion fee. Common models:
| Conversion Method | Fee Structure | Typical Range | Cost Efficiency |
|---|---|---|---|
| Flat Conversion Fee | Fixed dollar amount | $500 to $3,000 | Predictable regardless of timing |
| Hours Worked Credit | Markup credited toward fee or buyout triggers | 200 to 500 hours thresholds are common | Rewards longer evaluation periods; fee drops to zero after threshold in some agreements |
| Percentage of Salary | Annual salary percentage | about 8% to 15% | Scales with position value |
| Sliding Scale | Decrease over time | e.g., 15% down to 8% by month/quarter | Incentivizes faster decisions |
Notes: Many agreements waive conversion fees after a stated hours threshold (often around 480–720 or a specific figure, like 512/520 hours). See Sources.
Temp‑to‑Hire Total Cost Analysis
- Short evaluations (30–60 days): Conversion plus markup can exceed direct-hire costs if a quick decision is expected.
- Longer evaluations (90+ days): Accrued markup materially affects total cost; weigh direct hire vs extended temp.
- Optimal timing: For standard roles, cost‑efficient conversions often occur around 60 to 90 days, but exact timing depends on bill rate, pay rate, and conversion terms.
Regional Markup Analysis: North Carolina Market
North Carolina pricing aligns with national patterns while reflecting regional labor costs and competitive dynamics.
North Carolina Pricing Factors
Competition and volume: Long‑tenured agencies with volume programs often apply operational efficiencies to sustain competitive, all‑in rates.
Regional cost structure: Compared to large metro hubs, certain NC markets enjoy lower operating costs, which supports competitive pricing without service reductions.
North Carolina Industry Markup Patterns
| NC Industry Focus | Markup Range | Regional Advantages |
|---|---|---|
| Manufacturing (Triad) | about low‑20s to low‑30s | Established networks Safety programs Quick scaling |
| Technology (Triangle) | about high‑20s to mid‑40s | Technical screening Clearance familiarity |
| Financial Services (Charlotte) | about mid‑20s to ~40% | Regulatory experience Professional networks |
| Professional Services (Statewide) | about mid‑20s to high‑30s | Local pay insight Cultural fit assessment |
Notes: Use these as planning bands. Confirm with current role, pay rates, site requirements, and volume commitments.
Hidden Costs and Transparent Pricing Evaluation
Beyond headline percentages, evaluate total cost, including potential add‑ons and service limitations.
Common Additional Fee Structures
| Fee Category | Typical Cost | When Applied | Transparency Level |
|---|---|---|---|
| Background Check Fees | about $25 to $150 per candidate | Role‑specific screens (criminal, MVR, education) | Usually disclosed |
| Skills Assessment Fees | about $50 to $200 per candidate | Technical or professional testing | Sometimes buried |
| Guarantee Extension Fees | about $500 to $2,000 | Longer replacement windows | Often not highlighted |
| Rush Placement Premiums | about 10% to 25% more | Urgent timelines | May be added ad hoc |
| Contract Modification Fees | about $100 to $500 | Mid‑placement changes | Sometimes undisclosed until needed |
Transparent pricing benefits
All‑inclusive models eliminate surprise charges and simplify budgeting
Clear guarantee terms spell out replacement windows without extras
Documented service levels define what screening, onboarding, and follow‑up are included
Value Assessment Beyond Markup Percentages
Focus on total value delivered, not just the headline percentage.
Total Cost of Staffing Analysis
Internal costs: Recruiter time, advertising, screening, and opportunity costs often rival agency markups for equivalent results.
Quality metrics: Retention, time‑to‑productivity, and fit outcomes provide an apples‑to‑apples ROI view.
Risk mitigation: Guarantees, replacements, and compliance support reduce exposure and administrative burden.
Partnership Selection Criteria
- Transparent pricing with documented inclusions and exclusions
- Local market expertise for accurate compensation and supply forecasting
- Proven performance (retention, fill ratios, client satisfaction)
Calculation Methodology
Markup Rate Formula for Different Placement Types
- Temporary Staffing Markup Rate = (Bill Rate − Pay Rate) ÷ Pay Rate × 100
- Direct Hire Fee Percentage = Placement Fee ÷ Annual Salary × 100
- Temp‑to‑Hire Total Cost = (Markup × Hours Worked) + Conversion Fee
Data Sources and Verification
Primary sources:
- Staffing Industry Analysts (fee/markup structures; most common direct hire fee ~20%).
- SHRM (buyer guidance on markup ranges and caveats at higher percentages).
- Reputable staffing, finance, and buyer advisories (broad temporary markup bands; direct hire norms).
- State and BLS labor data (context for local pay baselines)
Methodology approach:
- Use published industry ranges as planning frameworks.
- Adjust for service complexity, role risk, and scarcity.
- Reflect regional variation and competitive factors.
- Align with transparent pricing practices from established agencies
Further Reading & Staffing Cost Analysis
To gain a deeper understanding of staffing agency pricing and value, explore the following resources and frameworks. These will help clarify placement type strategies, service level comparisons, regional trends, and ROI methods:
- Placement type comparison guides: direct hire vs temporary vs temp‑to‑hire cost strategies
- Service level evaluation frameworks: basic vs premium value assessment
- Regional analysis: North Carolina staffing cost patterns and competitive intelligence
- ROI methods: total cost of staffing vs internal hiring expense comparison
Next Step: Contact The Resource at 336‑896‑1000 for transparent markup analysis and comprehensive pricing evaluation tailored to your North Carolina staffing requirements.
Sources and Data References
- Staffing Industry Analysts: Direct hire fee norms (20% most common)
- SHRM: Buyer guidance on staffing markups (30–40% to as high as 150% in some cases; scrutinize >50%)
https://www.shrm.org/topics-tools/news/hr-magazine/art-choosing-staffing-agency
- Paychex: Cost to hire overview (agency fees often 15–25% of first‑year comp)
https://www.paychex.com/articles/human-resources/cost-of-hiring-an-employee
- Advance Partners (Paychex company): Markup overview (typical temporary markups ~25% to 100% depending on role and market)
https://www.advancepartners.com/calculate-how-to-price-your-staffing-services/
- altLINE (SouthState Bank): Explainer on markup rate math and factors
https://altline.sobanco.com/staffing-agency-markup-rates/
- Second Talent / FoxHire / industry advisories: Temp‑to‑hire conversion fee methods (salary percentage, flat fees, hours‑credit thresholds; common thresholds ~480–520+ hours)
https://www.secondtalent.com/resources/staffing-agency-fee-structures/
https://www.activatedscale.com/blog/temp-perm-staffing-agreement-guidelines
https://www.foxhire.com/blog/q-a-what-do-i-need-to-know-about-conversion-fees
Notes
Ranges above reflect current buyer advisories and industry reports through 2025. Exact pricing depends on role, location, pay rates, volume, risk, and contract terms. Where ranges were annotated in the draft, they have been aligned to published benchmarks and credible buyer guidance.